Introduction
Weight measurement is fundamental in the management of paediatric inpatients for medication doses, fluid and dietary requirements. It is also a simple and reliable tool to measure child health, growth and nutrition. Infants should have their weight checked regularly to ensure proper nutrition and growth.1 Weight is important for older children with chronic conditions (such as inflammatory bowel disease) for monitoring disease progression and success of therapy. 2 Recently, STAMP (Screening Tool for the Assessment of Malnutrition in Paediatrics) was introduced at our institution, and requires that all paediatric inpatients have both their height and weight recorded. 3
Many methods have been described for estimating a patient’s weight in the acute setting, including a visual estimation, Broselow tape, and mathematical formulae based on age.4
Broselow tape is a large tape measure which offers an estimated weight plus emergency drug doses based on the length of a patient. A recent study found that Broselow tape is only highly accurate for patients between 10kg and 25kg.5 While length-based estimations and parental estimations have been shown to be the best predictors of actual body weight, age-based estimations have shown to also predict ideal body weight.6 These estimations may not take into account weight changes with disease e.g. dehydration.
In our institution, the current Advanced Paediatric Life Support (APLS) 2017 guidelines7 are used. APLS published a chart, one for male one for female patients, listing a range of ages and their estimated weight (alongside other resuscitation necessities including energy needed for defibrillation in Joules, and amount of normal saline needed for a 20 ml/kg fluid bolus.
The aims of this study were to audit the recording of height and weight records amongst paediatric inpatients, assess the accuracy of the APLS 2017 estimated weight guidelines) by comparing measured weights with estimated equivalent), and to compare the difference between estimated weight and measured weight among children of different age groups and presenting complaints.
Methods
Ethical approval was obtained from the University Hospital Limerick Ethics committee. Consent was waived by the ethics committee. The study was performed at University Hospital Limerick. The medical charts of 100 paediatric inpatients admitted successively to the inpatient ward or seen in the day ward over the course of May 2017 were reviewed. Inclusion criteria were any patient admitted to the paediatrics ward, aged up to 16 years. Patients admitted under either medical or surgical specialists were eligible for inclusion. Each subject was included once only. There were no other exclusion criteria. Data collected included age, gender, indications for admission, chronic conditions, measured height and measured weight.
The weight of each included subject was estimated, using the 2017 Advanced Paediatric Life Support guidelines (sixth edition). 7 For the purposes of analysis, all patients were divided into three age groups for comparison. The groups were “Pre-school” (0 – 5 years), “Primary School” (5 – 12 years) and “Secondary School” (> 12 years). Data were entered into a Microsoft excel file and analysed using the same. Measured weight was compared with estimated weight for each child along a Bland-Altman plot, and this was subdivided into each weight group for further comparison. A 1% significance level was used for all analysis.
Results
Demographics
Of 100 included subjects, 53% were female and 47% were male. Fifty (50%) subjects were in the Pre-School group, 32% in the Primary School group and 18% in the Secondary School group.
Twenty (20%) of subjects presented with respiratory complaints, 19% with surgical complaints, 16% gastroenterological, 14% neurological.
Compliance with documentation
All patients had a weight documented. However not one chart recorded whether the weight documented was estimated or measured. Only 13% of patients had their height recorded. As such the authors were unable to calculate BMI for most patients. Then, for the purposes of weight comparison, it was assumed that all weights were measured.
Accuracy of estimated weight
Figure 1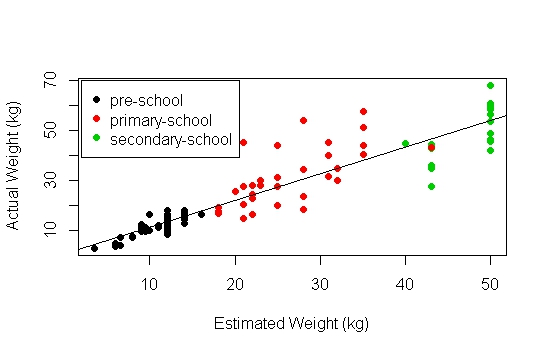
Figure 1 shows estimated weight and measured weight are highly positively correlated (rho = 0.92). Linear regression model showed that estimated weight was a good predictor of actual weight (p < 0.001, R2 = 0.85). Normality of residuals was analysed, however the shapiro-wilk normality test (w 0.88, p <0.001) showed that residuals were not normal. Therefore, the linear model was not a suitable fit. Based on the scatter plot (figure 1) and separation by age group, the data was further analysed per age group.
Pre-school regression analysis
The average measured weight was 11.44kg. Linear regression model showed that estimated weight was a good predictor of actual weight for pre-school aged children (p < 0.001, R2 = 0.78). Residuals were found to be normally distributed (w = 0.98, p = 0.4).
Figure 2
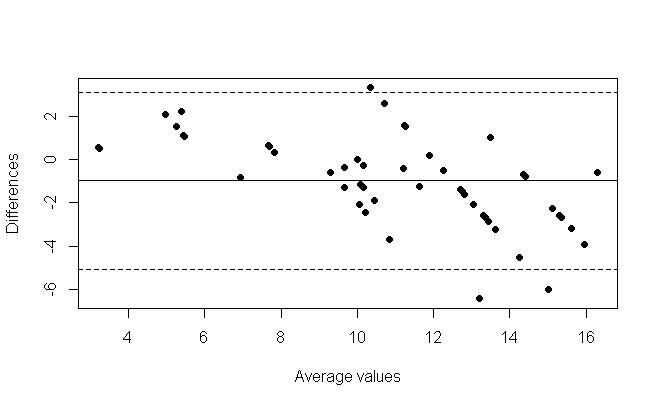
Figure 2 is a Bland-Altman plot for estimated weight and measured weight for the pre-school child. It shows the average weight plotted against the difference in weight (estimated weight minus measured weight). The average difference was -0.98kg, which indicates that on average the weight was underestimated. This represents an 8.56% average percentage difference. There is a slope in the bland altman plot which is suggested by the slope of the linear regression model (m = 1.26).
Primary-school regression analysis
The average measured weight was 26.38kg. Linear regression model showed that estimated weight was a good predictor of actual weight for primary-school aged children (p < 0.001) but does not capture the majority of the variability (R2 = 0.46). Residuals were found to normally distributed (w = 0.93, p = 0.04).
Figure 3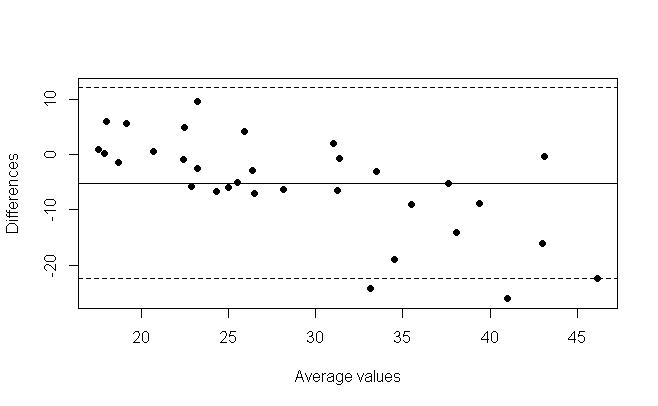
The bland altman plot for the primary school group (figure 3) showed on average an underestimation of 5.17kg, with estimated weight lower than measured weight. This represents a 16.39% average percentage difference. There is a slope in the bland altman plot which is suggested by the slope of the linear regression model (m = 1.29).
Secondary-school regression analysis
The average measured weight was 47.5kg. Linear regression model showed that estimated weight was a good predictor of actual weight for secondary-school aged children (p < 0.01) but does not capture the majority of the variability (R2 = 0.45). Residuals were found to normally distributed (w = 0.96, p = 0.64).
Figure 4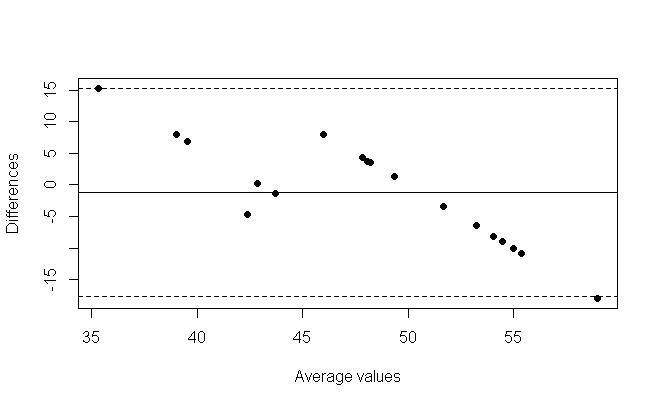
The bland altman plot for the secondary school group (figure 4) showed on average an underestimation of 1.14kg, with estimated weight lower than measured weight. This represents a 2.34% average percentage difference. There is a slope in the bland altman plot which is suggested by the slope of the linear regression model (m = 1.89).
Discussion
In 100 successive admissions to a University Hospital General Paediatrics ward, there was poor documentation if a child’s weight was a measured or estimated value. These patients were admitted via the emergency department as well as elective admissions and admissions via the day ward. It is unlikely that every child admitted had a weight measured. The clear differences between measured weights and estimated weights imply that it is difficult to rely on any weight, unless the treating medical team knows the origin of this weight. Conditions such as fluid resuscitation, medication dosing calculations require accurate weights. Conditions such as diabetic ketoacidosis have associated morbidity and mortality risk through use of inaccurate weights.
Knowledge of a child’s weight is paramount to management of both acute and long-term paediatric medical issues. Unfortunately, in emergency paediatrics, this is not always possible. For example, in a resuscitation scenario, control of airway, breathing and circulation take priority over weight measurement. In these scenarios, the weight is estimated but should be measured as soon as is practical. Furthermore, with increasing obesity prevalence, accurate weights are even more important. In this study we have shown that the current APLS guidelines are reasonably accurate; but that accuracy decreases with increasing age. For all age groups, our results showed that the estimated weight was in fact a good predictor for measured weight however they do not include that majority of the variability of weights, especially in older children (primary and secondary school aged children).
The was an average underestimation of weight of 1kg in pre-school children, 5.17kg in primary school aged children and 1.14kg in secondary school aged children. Bland Altman plots do not measure the clinical significance of these figures.
The study has limitations. The sample size is small. The data were collected prospectively on routinely collected data, but it was disappointing that the origin of the weight was not recorded after an education phase for admitting staff. This education session will be repeated. We assumed that all weights recorded were measured. But if some of these were estimated weights, then the true variability between measured and estimated weights is likely to be even larger than identified in the study. The study also has strengths. To our knowledge, it is the first of its kind in Ireland and it highlights flaws in a basic clinical measurement tool which should be rectified.
A key learning point from this study is that all children should have a measured weight and height the morning after admission to the ward. This is best performed before breakfast and fluid intake.
Conflict of Interest:
The authors to not have any conflict of interest to declare.
Corresponding Author:
C. Lineen,
Department of Paediatrics,
The Children’s Ark,
University Hospital Limerick
Email: [email protected]
References
1. National Guideline A. National Institute for Health and Care Excellence: Clinical Guidelines. Faltering Growth - recognition and management. London: National Institute for Health and Care Excellence (UK)
Copyright (c) National Institute for Health and Care Excellence 2017.; 2017.
2. Rufo PA, Denson LA, Sylvester FA, Szigethy E, Sathya P, Lu Y, Wahbeh GT, Sena LM, Faubion WA. Health Supervision in the Management of Children and Adolescents With IBD: NASPGHAN Recommendations. Journal of pediatric gastroenterology and nutrition. 2012;55(1):93-108.
3. McCarthy H, Dixon M, Crabtree I, Eaton-Evans MJ, McNulty H. The development and evaluation of the Screening Tool for the Assessment of Malnutrition in Paediatrics (STAMP©) for use by healthcare staff. Journal of Human Nutrition and Dietetics. 2012;25(4):311-8.
4. Argall JAW, Wright N, Mackway-Jones K, Jackson R. A comparison of two commonly used methods of weight estimation. Archives of Disease in Childhood. 2003;88(9):789-90.
5. AH AL, Al-Ojyan FI, Al-Mulhim KN, Alotaibi TS, Alqurashi FO, Almoaibed LF, MH AL, MA AL. The accuracy of Broselow pediatric emergency tape in estimating body weight of pediatric patients. Saudi medical journal. 2017;38(8):798-803.
6. Young KD, Korotzer NC. Weight Estimation Methods in Children: A Systematic Review. Annals of Emergency Medicine.68(4):441-51.e10.
7. Introduction. Advanced Paediatric Life Support: John Wiley & Sons, Ltd; 2016. p. 1-11
P910