Introduction
Peter Townsend defined social deprivation as a state of “observable and demonstrable disadvantage relative to the local community to which an individual belongs”1. Within society local small area groups of people can be categorized into strata of relative deprivation using a deprivation index2. These small area groups have been demonstrated to have different healthcare outcomes based on deprivation3-7. Emergency medical conditions present more frequently in areas with increased deprivation; this may result in an up to eightfold difference in the annual admission incidence rate of common medical conditions from 5/1000 to 40/10004, 5, 8. Our institution has a catchment area combining over 50% of patients labelled as deprived and an aging population; we have previously demonstrated the essentially linear relationship between the Irish National Deprivation Index and the annual admission incidence to our hospital4,5. Data on broadband access rates were made available in the census returns of 2006; we have demonstrated that broadband access was just as predictive of the emergency admission incidence rates as car and non-housing ownership9. Broadband access may be a surrogate marker of educational status, as the ‘early adopters’ could be anticipated to be more likely to be educated to a higher standard; the census returns also report data on other educational measures such as the percentages of the population who have completed their education by age 15, 18 or >18 years of age. In this paper we investigate as to whether the emergency admission incidence rate is a sensitive indicator of healthcare outcomes related to local area social circumstances. To this end we have sought to determine the effect of broadband access and educational status and their interaction on local population health, as evidenced by the emergency medical admission incidence rate.
Methods
Our institution, St. James Hospital (SJH), serves as a secondary care centre for emergency admissions for its local Dublin catchment area of 270,000 adults. Emergency medical patients are admitted from the Emergency Department directly to a 59-bed Acute Medical Admission Unit (AMAU) opened in 2003, the operation and outcome of which have been described previously10-12. We utilized an anonymous patient database assembling core information about each clinical episode from elements contained on the national hospital in-patient enquiry (HIPE) scheme, the patient electronic record, the Emergency Department and laboratory systems. HIPE is a national database of coded discharge summaries from acute public hospitals in Ireland13. Ireland used the International Classification of Diseases, Ninth Revision, Clinical Modification (ICD-9-CM) for both diagnosis and procedure coding from 1990 to 2005 and ICD-10-CM since then.
Data held on the database includes date of birth, gender, area of residence, and principal and secondary diagnoses and procedures. Additional physiological, haematological and biochemical parameters are recorded at the time of admission. Data for this study was related to all general medical patients admitted through the Emergency Department to SJH for the years 2002–2014. Analysis of the annual admission incidence rate data was confined to the 73% of admissions who resided in our catchment area - as including those residing elsewhere would make calculations of the annual incidence rates unreliable due to potential confounding from admissions to another hospital.
The Republic of Ireland census (Central Statistical Office) returns report small area population statistics (SAPS); the reporting unit is the Electoral Division. Of the national total of 3409, 74 Electoral Divisions are in our hospital catchment area. The National Deprivation Index uses methodology similar to Townsend and Carstairs to derive a Deprivation Index based on four indicators, relating to unemployment, social class, type of housing tenure and car ownership1,2,14. The assignment of patients to small areas used the ArcGIS geographic information system software implementation of the well-known Point-in-Polygon algorithm as outlined by Shimrat15. The annual incidence rate (rate/1000 population) of emergency medical admissions for our hospital catchment area was calculated by summing admissions for each Electoral Division over 13 years, calculating an average for each (numerator) and dividing by the total population within each area (divisor). The broadband access rates were calculated as the ratio of households with these versus total households within the Electoral Division. The age at which full time education had been completed (<=15 years, <=18 years and >18 years) was expressed as the ratio for each category to the total population within each Electoral Division. The census returns only report on those who have completed full time education, those still undertaking education do not answer this question in the census.
Descriptive statistics were calculated for background demographic data, including means/standard deviations (SD), medians/inter-quartile ranges (IQR), or percentages. Comparisons between categorical variables and mortality were made using chi-square tests. For hospital admission rates, we employed a truncated Poisson regression model. The Poisson regression coefficients are the log of the rate ratio: the rate at which events occur is called the incidence rate. Thus we can interpret the coefficients in terms of incidence rate ratios (IRR). In the multivariable truncated Poisson model, we adjusted univariate estimates of effect, using known outcome predictor variables of in-hospital mortality such as the Acute Illness Severity Score16,17, the Charlson Co-Morbidity Index18, Chronic Disabling Disease Score19, and Sepsis Status20.
Adjusted odds ratios (OR) and 95% confidence intervals (CI) or IRRs were calculated for those predictors that significantly entered the model. Statistical significance at P<0.05 was assumed throughout. Stata v.13.1 (Stata Corporation, College Station, Texas) statistical software was used for analysis.
Results
Patient Demographics
A total of 82,368 admissions were recorded in 44,628 patients admitted between 2002 and 2014. There were more females (51.3%) than males (48.5%). Their mean age was 67.7 years (95%CI 47.4 to 80.1) and mean hospital length of stay (LOS) was 6.3 days (95%CI 2.7 to 14.1).

Catchment Area Deprivation
The hospital catchment area is in an area of high deprivation; from a total of 74 Electoral Divisions within the hospital catchment area, fifty-six of these (75.7%) are in the top two quintiles of Deprivation Index (Q4=7/Q5=49). The median population per Electoral Division was 2845 (IQR 2020, 3399) with a total catchment of population of 210,443 persons in 2006. The median weighted admission rate incidence (/1000 population per annum) was 29.2 (IQR 13.9, 36.0); the 90th centile being at 50.7. Approximately 85% of admissions were from the highest quintile of Deprivation Index (Q5) and 5% each from Q1, Q3 and Q4.
Social Deprivation Markers and Baseline Demographics
We explored the categorical variables of broadband access, and persons who had the lowest (≤15 years) and highest (>18 years) completed full time education, dividing the catchment small areas into quintiles from the least (Q1) to the most (Q5). We present the comparison in Table 1 for broadband access categorised by quintiles one and two (less), quintile three, or quintiles four and five (more).
Social Deprivation Markers and Admission Rate Incidence
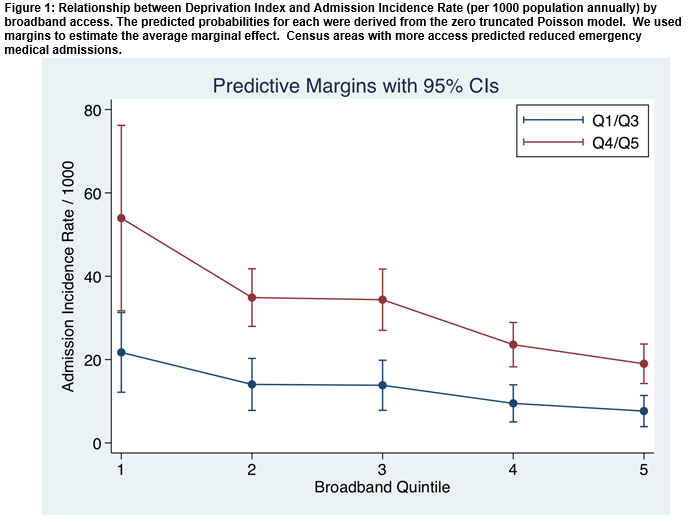
There was a clear relationship between the Admission Incidence Rate (/1000 population/per annum) and the quintiles of broadband access. Census areas with more broadband access predicted reduced emergency medical admissions (Figure 1). The median level of household broadband access was 37.6 (95%CI 30.7 to 44.7) in 2006; this ranged from a rate of 29.0 for Q1 to 54.5 for Q5. The predicted rate of admission rate incidence (/1000 population per annum), related to increasing broadband access (Figure 1), decreased from Q1 50.8 (95%CI 30.2, 71.4) to Q4 22.2 (95%CI 17.2, 27.2), and Q5 17.9 (95%CI 13.4, 22.4). The age of completion of full time education for up to 15 years was 12.8% (95%CI 7.7, 19.5), up to 18 years 20.6% (95%CI 13.2, 23.7) and >=18 years 24.5% (95%CI 17.7, 32.3). The remaining 42.1% were still undertaking education. Education ≤15 years predicted an increased admission rate, even when adjusted for Deprivation Index – IRR 1.14 (95%CI 1.13, 1.15). Education >=18 years predicted a decreased admission rate, even when adjusted for Deprivation Index – IRR 0.74 (95%CI 0.73, 0.75).
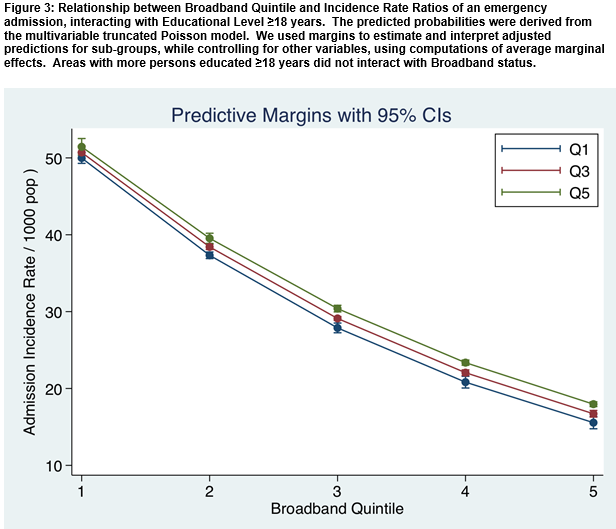
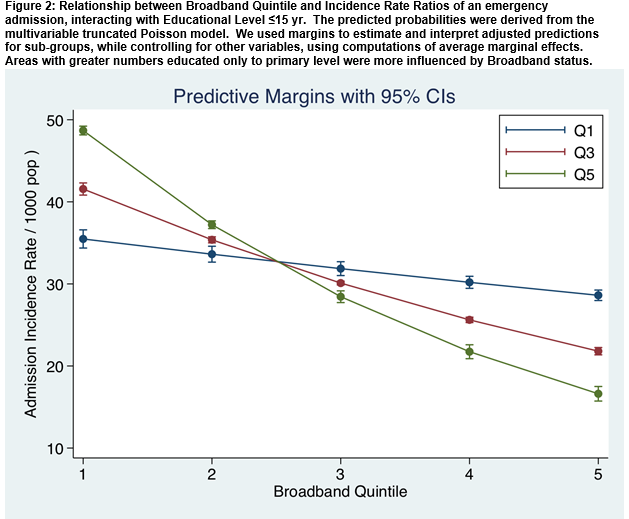
There was a significant interaction between the education level and the broadband/admission incidence relationship. The smallest rate of fall in the slope of the line relating broadband quintiles to admission incidence rates occurred in areas with lowest levels of education (i.e Q1) (Figure 2). There was a very significant interaction between education ≤15 years and broadband access in terms of prediction of the admission incidence rate (p<0.001) (Figure 2). However, considering educational status >18 years, there was no such interaction and the overall effect of broadband status in relationship to admission incidence rate was unrelated to educational status of persons advancing to third level education (Figure 3).
Discussion
We have demonstrated that broadband access is a linear predictor of the emergency medical admission rate. Furthermore we show that this effect is modulated by the underlying educational level of the population; areas with a greater percentage of the population who had completed education by age 15 demonstrated a more profound effect of broadband access on admission rates. While our data relates to one hospital only and uses a different, albeit related, Deprivation Index methodology, the absolute admission incidence rate appear quite similar to those calculated for UK data21. The reasons why discrete communities within our society have or acquire different healthcare outcomes is unclear; however the admission incidence rates are linearly related to Deprivation Index and appear deeply embedded within the structure of society. Our hospital is in a catchment area with a high intrinsic of rate of deprivation22; we have previously reported that hospital outcomes, including mortality, are worse from areas of higher deprivation3.
An emerging theme in healthcare is the concept of health literacy relating educational level and consequence skills in ability to access, utilize and empower healthcare decisions. Broadly speaking, this is defined as the capacity to obtain, process and understand basic health information and services needed to make appropriate health decisions - but broader definitions focus on a wider range of cognitive and social skills which enable adults to use information to promote good health23. Precisely how health literacy affects health status and health service utilization remains unclear24. However, it can be argued that core education level and achievements may be crucial25.
There are caveats however; the emergency admission rate is the result of social circumstances that may operate over many decades and the precise interpretation of such relatively short-term observations is uncertain. Our data on education level was confined to the 57.9% of the population who had completed their education and so were able to answer this question on education on the census return. Clearly broadband access is unlikely to be the direct effector of the emergency admission rate, rather it is reflective of other underlying factors in the fabric of societal structure. The identification of such predictors should not be viewed as a rationale for direct social intervention targeting them. It is unlikely that such efforts would yield success given the complexities involved in the effects of deprivation on healthcare outcomes3,7. An unavoidable limitation of our work is the inability to directly link the population and hospital data at an individual level due to the nature of the data. The population statistics are derived from the National Census and are aggregated down to the small area. They are anonymised for reasons of privacy and it is national policy not to release the data at any smaller level. Finally, the finding of a statistically significant association does not imply causation, indeed in the present case it is likely that broadband access is reflective of broader social inequalities; it may prove to have utility as a surrogate measure of these.
In conclusion we have demonstrated that broadband access is a predictor of the emergency medical admission rate. This effect is modulated by the baseline education level of the population; being most significant in areas with a high percentage completing their education at a younger age.
Correspondence to:
Dr Bernard Silke, Department of Internal Medicine, St James’s Hospital, Dublin 8, Ireland
E-Mail: [email protected]
Ph: +353 1 416 2777
Conflict of Interest
We declare that we have no conflicts of interest in regards to this manuscript.
References
1. Townsend P. Deprivation. Journal of Social Policy. 1987;16:25-46.
2. Kelly A, Teljeur C. SAHRU National Deprivation Index Trinity College, Dublin2007 [Available from: http://www.sahru.tcd.ie/services/ deprivation/DeprivationFiles/WebReport07.pdf.
3. Conway R, Galvin S, Coveney S, O'Riordan D, Silke B. Deprivation as an outcome determinant in emergency medical admissions. QJM. 2013;106(3):245-51.
4. Conway R, Byrne D, O'Riordan D, Cournane S, Coveney S, Silke B. Deprivation index and dependency ratio are key determinants of emergency medical admission rates. European journal of internal medicine. 2015;26(9):709-13.
5. Cournane S, Dalton A, Byrne D, Conway R, O'Riordan D, Coveney S, Silke B. Social deprivation, population dependency ratio and an extended hospital episode - Insights from acute medicine. European journal of internal medicine. 2015;26(9):714-9.
6. Conway R, Byrne D, O'Riordan D, Cournane S, Coveney S, Silke B. Influence of social deprivation, overcrowding and family structure on emergency medical admission rates. QJM. 2016.
7. Conway R, O'Riordan D, Byrne D, Cournane S, Coveney S, Silke B. Deprivation influences the emergency admission rate of ambulatory care sensitive conditions. Clinical medicine (London, England). 2016;16(2):119-23.
8. Tian Y, Dixon A, Gao H. Emergency hospital admissions for ambulatory care-sensitive conditions: identifying the potential for reductions 2012 [updated Feb 16. 1-13]. Available from: http://www.kingsfund.org.uk/sites/files/kf/field/field_publication_file/data-briefing-emergency-hospital-admissions-for-ambulatory-care-sensitive-conditions-apr-2012.pdf.
9. Conway R, Cournane S, Byrne D, O'Riordan D, Coveney S, Silke B. Broadband access, housing and car ownership as deprivation predictors of the emergency medical admission. European journal of internal medicine. 2016.
10. Conway R, O'Riordan D, Silke B. Long-term outcome of an AMAU--a decade's experience. QJM. 2014;107(1):43-9.
11. Coary R, Byrne D, O'Riordan D, Conway R, Cournane S, Silke B. Does admission via an acute medical unit influence hospital mortality? 12 years' experience in a large Dublin hospital. Acute medicine. 2014;13(4):152-8.
12. Conway R, Byrne D, O'Riordan D, Silke B. Patient risk profiling in acute medicine: the way forward? QJM. 2015;108(9):689-96.
13. O'Loughlin R, Allwright S, Barry J, Kelly A, Teljeur C. Using HIPE data as a research and planning tool: limitations and opportunities. Ir J Med Sci. 2005;174(2):40-5; discussion 52-7.
14. Carstairs V, Morris R. Deprivation and mortality: an alternative to social class? Journal of Public Health. 1989;11(3):210-9.
15. Shimrat M. Algorithm 112: Position of point relative to polygon. Commun ACM. 1962;5(8):434.
16. Silke B, Kellett J, Rooney T, Bennett K, O'Riordan D. An improved medical admissions risk system using multivariable fractional polynomial logistic regression modelling. QJM. 2010;103(1):23-32.
17. O'Sullivan E, Callely E, O'Riordan D, Bennett K, Silke B. Predicting outcomes in emergency medical admissions – role of laboratory data and co-morbidity. Acute medicine. 2012;2:59-65.
18. Charlson ME, Pompei P, Ales KL, MacKenzie CR. A new method of classifying prognostic comorbidity in longitudinal studies: development and validation. J Chronic Dis. 1987;40(5):373-83.
19. Chotirmall SH, Picardo S, Lyons J, D'Alton M, O'Riordan D, Silke B. Disabling disease codes predict worse outcomes for acute medical admissions. Intern Med J. 2014;44(6):546-53.
20. Chotirmall SH, Callaly E, Lyons J, O'Connell B, Kelleher M, Byrne D, O'Riordan D, Silke B. Blood cultures in emergency medical admissions: a key patient cohort. European journal of emergency medicine : official journal of the European Society for Emergency Medicine. 2016;23(1):38-43.
21. Tian Y, Dixon A, Gao H. Emergency Hospital Admissions for Ambulatory Care-Sensitive Conditions: Identifying the potential for reductions. Data briefing London2012 [Available from: www.kingsfund.org.uk/publications/data_briefing.html.
22. Walsh JB, Coakley D, Murphy C, Coakley JD, Boyle E, Johnson H. Demographic profile of the elderly population in Dublin accident and emergency hospital catchment areas. Ir Med J. 2004;97(3):84-6.
23. Smith S, McCaffery K. Health Literacy: a brief literature review. Produced for the NSW Clinical Excellence Commission, Australia. 2010.
24. Lee S-YD, Arozullah AM, Cho YI. Health literacy, social support, and health: a research agenda. Soc Sci Med. 2004;58(7):1309-21.
25. Central Statistics Office. Life Expectancy: Period Life Expectancy at Various Ages (Years) by Sex, Year and Age Dublin: Central Statistics Office, Ireland; 2010 [Available from: http://www.cso.ie/Quicktables/GetQuickTables.aspx?FileName=VSA30.asp&TableName=Life+Expectancy&StatisticalProduct=DB_VS.
(P636)