Introduction
Worldwide, 43 million children are overweight or obese1. Recent projections from American data suggest that the obesity epidemic may lead to shorter life expectancies in the current generation2. Amongst Irish adults, 25% are obese3. Between 1990 and 2000, the prevalence of obesity increased by 67%4. Ireland has the fourth highest prevalence of overweight and obesity in men in the EU5. In 2011, Growing Up in Ireland (GUI) data on 9 year old Irish children identified the prevalence of overweight and obesity as 19% and 7%, respectively6.
A leading factor in the development of childhood obesity is parental obesity7,8. Children are at increased risk of obesity if both parents are obese9. Parental body mass index (BMI) is one risk factor. Although BMI has clinical limitations10,11, it has a role in tracking weight status in populations and as a screening tool. Three critical time-periods have been observed for the onset of obesity in childhood: the prenatal period, preschool, and adolescence12. The impact of parental BMI on the severity of obesity in children increases at transition into adolescence13. In one population-based study, the severity of obesity at age 15 years correlated positively with both maternal and paternal BMI (P < 0.01).6
More robust correlations have been reported between the weights of a mother and her child than between a father and his child2,14,15. The relationship between maternal and child BMI has been well documented8,16,17,18,19, whereas the effect of paternal BMI is less well-described8,12.
The aims of this study were to use data from the GUI database to:
1) Examine whether differences exist between paternal self-reported and measured height, weight and BMI classification;
2) Explore paternal perceptions of their own weight status;
3) Assess relationship between paternal BMI and his child’s BMI.
Methods
The GUI study is a nationally representative cohort study of 8,568 nine-year-old school children and their caregivers living in the Republic of Ireland. A two-stage sampling methodology within the primary school system was conducted. In stage one, 1,105 primary schools were selected from the national total of 3,177 using a probability proportionate to size (PPS) sampling method. Nine hundred and nine (82.3%) selected schools agreed to participate. Stage two involved the random selection from all eligible children within each school, with 57% of selected children (and their families) participating in the study. These children represent approximately 1 in 7 of all children aged 9 years resident in the Republic of Ireland at the time of sample selection in 2006. The sample was weighted by adjusting the distribution of the sample to known population characteristics of children and their families from the 2006 Census of Population in Ireland. Characteristics accounted for in the weights included family structure, social class, economic and disadvantaged status. Written informed consent was obtained from both parent/guardian and study child prior to data collection. All stages of the GUI project were subject to ethical review by the Irish Health Research Board’s Research Ethics Committee.
Trained social interviewers conducted computer-assisted personal interviews with the study child and both parents/guardians (where applicable) in the home. Parents nominated a primary caregiver (the parent who spent most time with the study child) and a secondary caregiver. Due to the small number of female secondary caregivers in this sample (n=54 compared to n=6,481 males), this report focuses on male secondary caregivers only whose relationship to the study child is described as parent (referred to as fathers for the remainder of this paper). A self-report of weight (kg), height (cm) and self-perceived weight status (categorised as very underweight, moderately underweight, slightly underweight, about the right weight, slightly overweight, moderately overweight and very overweight) was recorded for all fathers.
Measures of height and weight were obtained by trained interviewers using validated methods during the household interview visit20. Height was measured using a Leicester portable height stick to the nearest 0.1 cm. Weight was measured using a portable flat mechanic scale (SECA 761, Seca Ltd., Birmingham, United Kingdom) to the nearest 0.5 kg. Both the father and study child wore light clothing when weighed. Paternal BMI was calculated as weight in kilograms/(height in metres)2 and classified as underweight (BMI <20 kg/m2), normal (BMI <25 kg/m2), overweight (BMI ≥25 and <30 kg/m2) or obese (≥30 kg/m2) according to the World Health Organization BMI classifications.21 The International Obesity Taskforce cut-offs were used to categorize BMI for the study children as follows: normal (male: BMI < 19.46 kg/m2; female: BMI < 19.45 kg/m2); overweight (male: BMI≥ 19.46; female: BMI ≥ 19.45 kg/m2); obese (male: BMI ≥ 23.39; female: BMI ≥ 23.46 kg/m2)22.
Differences between self-reported and measured height, weight and BMI of the fathers were calculated and tested for normality. Median differences (interquartile range) are presented for skewed data and mean difference (SD) for normally distributed data. Differences were compared across BMI classification (normal, overweight, obese) using non-parametric tests for independent samples or one-way ANOVA. A two-way mixed single measure interclass correlation coefficient (ICC) was used to assess the extent of agreement between father’s self- reported and objectively measured height and weight. A 5% level of significance was used for all statistical tests. Statistical analysis was carried out using SPSS version 20 for Windows and SAS Version 9.2 for Windows.
Results
Six thousand, two hundred and sixty-three (73.1%) fathers, with a mean age of 42 years (SD 5.04) provided information on themselves and the study child. Measured height was available for 5,944 (94.9%) of the fathers who participated; mean height was 177cm (SD 6.57). Measured weight was available for 5919 (94.5%) fathers who participated; median weight was 86kg (first quartile=78kg, third quartile=95kg). Complete data was available for BMI calculation in 5,895 (94.6%) fathers who participated; measured BMI data identified 0.1% as underweight, 21.5% as healthy, 50.6% as overweight and 27.8% as obese. Median BMI was 27.7 kg/m2 (first quartile=25.4, third quartile=30.3kg/m2).
The mean difference between self-reported and measured weight was -1.03kg (SD=4.52). The mean difference between BMI derived using self-reported data and BMI derived from measured data was -0.58 (SD=1.70). BMI calculated using self-reported weight and height correctly classified 70.6% of fathers with a healthy measured BMI, 79.0% of fathers as overweight, and 88.8% of fathers as obese. The underestimation of weight and BMI increases with BMI category (Table 1). While differences in height, weight and BMI for the fathers were statistically significant across their measured BMI category (p<0.001), this is influenced by the large sample size.
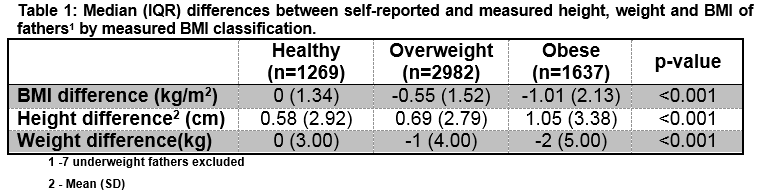
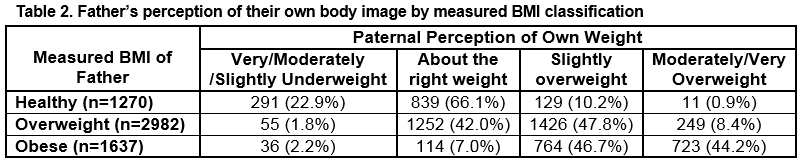
Table 2 compares the father’s self-perceived weight status and their measured BMI classification.
Measured height and weight were available for 7916 (92%) of the full cohort of study children. Measured BMI classification of the boys (n=4076, (51%)) identified 78.1% as healthy weight, 16.6% as overweight and 5.3% as obese. Measured BMI classification of the girls (n=3840, (49%)) identified 70.1% as healthy weight, 22.2% as overweight and 7.7% as obese.
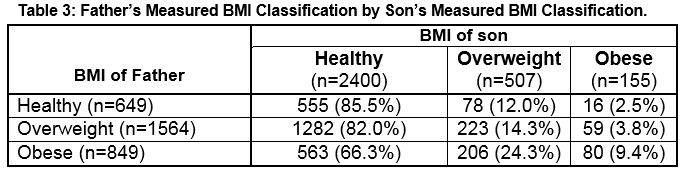
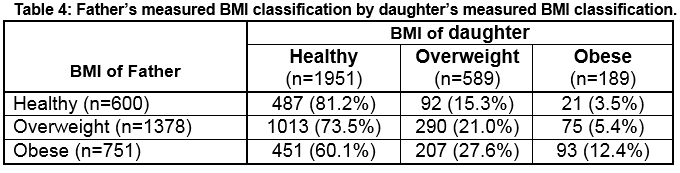
Of the children with paternal information available (n=6263), measured BMI classification for the boys identified 78.3% as healthy weight, 16.6% as overweight and 5.2% as obese. Measured BMI classification of the girls identified 71.6% as healthy weight, 21.5% as overweight and 6.9% as obese. Obese fathers were more likely to have an obese son (9.4% compared to 5.3% for the full cohort) (Table 3). Similarly, obese fathers were more likely to have an obese daughter (12.4% compared to 7.7%) (Table 4).
Discussion
This Growing up in Ireland study of greater than 6,000 fathers offers a representative view of the Irish population. A recently published systematic review investigating the involvement of fathers in obesity treatment and prevention programs targeting children and adolescents, found that out of 213 eligible RCTs that limited participation to one parent, fathers represented only 6% of parents23. A significant strength of the study is the objective measures of height and weight, obtained using validated methods. The majority of the fathers included in this study were overweight/obese (78.4% overall; 50.6% overweight; 27.8% obese). This is comparable to the Slan survey of 2007 (45% overweight, 24% obese)2.
We found that obese fathers were more likely to have an obese son (9.4% compared to 5.3% for the full cohort) and obese daughter (12.4% compared to 7.7%). Perez-Pastor et al identified that the risks of obesity at 8 years were 10-fold greater (girls 41%, P<0.001) or six-fold greater (boys 18%, P<0.05) if the same-sex parent was obese. This may be significant in directing family therapies. A limitation to this study is that the final analysis was carried out utilising the BMI of both parents taken at only one point, when the child was at age 5, whereas the children were measured at two annual time points, up to age 8. In comparison, in our GUI study, the fathers’ weights were measured contemporaneously with the weights of the children24.
Only 723 (44%) obese fathers identified themselves as ‘moderately/very overweight’ (Table 2); 291 (22.9%) fathers with a healthy BMI, perceived themselves as being ‘underweight’. This misperception of their own weight may lead to a misperception of their child’s weight. A recently published study identified that only 39.4% of mothers of overweight boys and 46.1% of overweight girls classified their children as overweight and only 17.6% of mothers of obese boys and 17.6% of obese girls identified their children as moderately/very overweight25. A limitation of our study is that father’s perception of their child’s weight and BMI was not assessed.
Our data suggest that there is a strong positive relationship between fathers' weights and his children’ weights. At a minimum, this data suggests that tackling overweight and obesity in the child should occur simultaneously with tackling overweight and obesity in the parents; in this study, the fathers.
Acknowledgements: We would like to acknowledge Prof. Ailish Hannigan and Dr. Helen Purtill, Graduate Entry Medical School, University of Limerick, for their statistical support.
Conflicts of Interest
The authors have no conflicts of interest to declare.
Corresponding Author:
Clodagh S O’Gorman, GEMS3-019, Graduate Entry Medical School, University of Limerick, Castletroy, Limerick, Ireland.
Email: [email protected]
Telephone: +353 61 234953
References:
1 De Onis M, Blössner M, Borghi E. Global prevalence and trends of overweight and obesity among preschool children. The American journal of clinical nutrition 2010;92(5):1257-64
2 Olshansky SJ, Passaro DJ, Hershow RC, Layden J, Carnes B, Brody J, Hayflick L, Butler R, Allison DB, Ludwig DS. A potential decline in life expectancy in the United States in the 21st century. NEJM 2005; 352: 1138-45.
3 Morgan K, McGee H, Watson D, Perry I, Barry M, Shelley E, Harrington J, Molcho M, Layte R, Tully N, van Lente E, Ward M, Lutomski J, Conroy R, Brugha R (2008). SLÁN 2007: Survey of Lifestyle, Attitudes & Nutrition in Ireland. Main Report. Dublin: Department of Health and Children.
4 Irish Universities Nutrition Alliance (2001) North/South Ireland Food Consumption Survey. www.iuna.net
5 International Obesity Taskforce and European Association for the Study if Obesity (2002) Obesity in Europe – The Case for Action.
6 Layte R, McCrory C. Growing Up in Ireland: National Longitudinal Study of Children: Overweight and Obesity Among 9-year-olds. Dublin: Stationery Office, 2011.
7 Maffeis C. Aetiology of overweight and obesity in children and adolescents. Eur J Pediatr 2000; 159 (Suppl 1): 35–44.
8 Lake JK, Power C, Cole TJ. Child to adult body mass index in the 1958 British birth cohort: associations with parental obesity. Arch Dis Child 1997; 77: 376–381.
9 Keane E, Layte R, Harrington J, Kearney PM, Perry IJ. Measured parental weight status and familial socio-economic status correlates with childhood overweight and obesity at age 9. PloS one 2012;7(8)
10 Centers for Disease Control and Prevention (2009a). Adult BMI Retrieved October 10, 2016, from http://www.cdc.gov/healthyweight/assessing/bmi/adult_bmi/index.html
11 Centers for Disease Control and Prevention (2009b). BMI for children and teens Retrieved August 10 Retrieved October 10, 2016, from http://www.cdc.gov/healthyweight/assessing/bmi/childrens_bmi/about_childrens_bmi.html
12 Dietz WH Critical periods in childhood for the development of obesity. Am J Clin Nutr. 1994 May; 9(5):955-9.
13 Svensson V, Jacobsson JA, Fredriksson R, Danielsson P, Sobko T, Schioth HB and Marcus C. Associations between severity of obesity in childhood and adolescence, obesity onset and parental BMI: a longitudinal cohort study Int J Obes (Lond). 2011 Jan; 35(1): 46–52.
14 Danielzik S, Langnase K, Mast M, Spethmann C, Muller MJ. Impact of parental BMI on the manifestation of overweight 5–7 year old children. Eur J Nutr 2002; 41: 132–138.
15 Maffeis C, Talamini G, Tato L. Influence of diet, physical activity and parents’ obesity on children’s adiposity: a four-year longitudinal study. Int J Obes Relat Metab Disord 1998; 22: 758–764.
16 Burke V, Beilin LJ, Dunbar D. Family lifestyle and parental body mass index as predictors of body mass index in Australian children: a longitudinal study. Int J Obes Relat Metab Disord 2001; 25: 147–157.
17 Danielzik S, Czerwinski-Mast M, Langnase K, Dilba B, Muller MJ. Parental overweight, socioeconomic status and high birth weight are the major determinants of overweight and obesity in 5–7 y-old children: baseline data of the Kiel Obesity Prevention Study (KOPS). Int J Obes Relat Metab Disord 2004; 28: 1494–1502.
18 Valerio G, D’Amico O, Adinolfi M, Munciguerra A, D0Amico R, Franzese A. Determinants of weight gain in children from 7 to 10 years. Nutr Metab Cardiovasc Dis 2006; 16: 272–278.
19 Gibson LY, Byrne SM, Davis EA, Blair E, Jacoby P, Zubrick SR. The role of family and maternal factors in childhood obesity. Med J Aust 2007; 186: 591–595.
20 Murray A, McCrory C, Thornton M, Williams J, Quail A, Swords L, Doyle E, Harris E. Growing Up in Ireland: Design, instrumentation and procedures for the child cohort. Ireland, Dublin: Department of Health and Children 2011
21 World Health Organisation. Physical status: The use of and interpretation of anthropometry, Report of a WHO Expert Committee. 1995. Accessed 02/02/2017
22 Cole TJ, Bellizzi MC, Flegal KM, Dietz WH. Establishing a standard definition for child overweight and obesity worldwide: international survey. Bmj 2000;320(7244):1240
23 Morgan PJ, Young MD, Lloyd AB, Wang ML, Eather N, Miller A, Murtagh EM, Barnes AT, Pagoto SL. Involvement of Fathers in Pediatric Obesity Treatment and Prevention Trials: A Systematic Review. Pediatrics. 2017 Feb;139(2).
24 Perez-Pastor EM, Metcalf BS, Hosking J, Jeffery AN, Voss JD, Wilkin TJ. Assortative weight gain in mother–daughter and father–son pairs: an emerging source of childhood obesity. Longitudinal study of trios (EarlyBird 43) International Journal of Obesity (2009) 33, 727–735; doi:10.1038/ijo.2009.76; published online 12 May 2009
25 Dowd KP, Kirwan R, Hannigan A, Purtill H, O’Gorman CS. The association between maternal perceptions of own weight status and weight status of her child: Results from a national cohort study. Arch Dis Child doi:10.1136/archdischild-2015-308721
P686