Introduction
Life expectancy at birth in Ireland has increased significantly for both men and women since the first official life table was compiled in 1926. Over the 85 year period to 2011, male life expectancy increased by 21.0 years (36.6%) to 78.4 years, while female life expectancy increased by 24.9 years (43.0%) to 82.6 years1. There has been considerable debate about whether the increased life expectancy results in improved health or higher levels of disability. It has been suggested that due to the increase in life expectancy, morbidity among elderly hospital patients has become more complex whereby the older patient is “made complex” by having multiple co-occurring medical conditions2. Patient complexity may affect process and outcomes of care and therefore measuring patient complexity is important to ensure best care for the patient. Furthermore, according to the Central Statistics Office (CSO), the older population (i.e. those aged 65 years and over) is projected to increase significantly from 532,000 in 2011 to 1.4 million in 2046 (163%)3. The very old population (i.e. those aged 80 years and over) is set to rise even more dramatically, increasing from 128,000 in 2011 to 484,000 in 2046 (278%)3. Thus, measurement of patient complexity, particularly in the elderly has important implications on how care is organised and how resources are allocated4. In Ireland, there have been no published studies measuring patient complexity. Thus the aim of this study is to use routinely collected hospital in-patient data to explore patient complexity and clinical outcomes in elderly patients over a 10 year study period.
Method
All emergency in-patient hospital admissions for elderly patients (i.e. those aged 65 years and over) to acute hospitals in Ireland between 2005 and 2014 were extracted from the Hospital In-patient Enquiry (HIPE) system via the Health Atlas Ireland system. HIPE is a computer-based health information system that collects data on discharges from acute public hospitals in Ireland.5 The HIPE database contains information on patient age, gender, area of residence, date of admission and discharge, together with their principal admitting diagnosis and up to 20 other diagnoses, coded using the International Classification of Diseases Tenth Revision (ICD-10-AM). Therefore, this study is based on in-patient emergency admissions with a hospital discharge record.
Patient complexity was measured using demographic variables, clinical profile and Charlson Index. The demographic profile included (mean age, age groups ( <85 years, ≥ 85 years) and gender). Clinical profile measures used included mean length of stay (LOS), percentage needing Intensive Care Unit (ICU) care; mean ICU LOS; the percentage who died in hospital; the Clinical Classification (CCS) group (which is a method whereby patient diagnoses and procedures are categorised into a manageable number of clinically meaningful categories and is based on ICD-10-AM6 and the Charlson Index which is method of categorizing co-morbidities of patients based on the International Classification of Diseases (ICD) diagnosis codes7. A score of zero is categorised as low complexity and a score of 10 or more is categorised as high complexity8.
The data were analysed using JMP statistical package9 and SPSS10. T-tests were used to compare means. Logistic regression was carried out on high/low Charlson index scores. Pearson's χ2-test was used to compare proportions in groups of categorical data, χ2-test for trend was used to identify linear trend in Statsdirect11.
Results
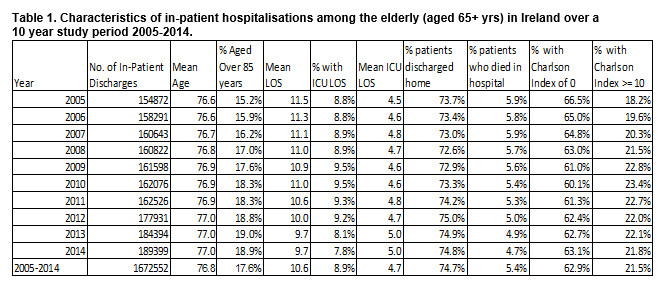
As shown in Table 1, there were 1,672,552 emergency in-patient hospital discharges for elderly patients (65 years and over) from acute hospitals over the ten year study period, increasing by 34,527 (22.3%) from 2005 to 2014, Cuzick trend analysis, Z= 2.95, p=0.003.
Age and gender
The mean age of the patients increased significantly from 76.7 (S.D. 7.3) years in 2005 to 77.0 (S.D 7.4) years in 2014 (2 sided T-test, F- statistic 82.9, p<0.001). The proportion of patients aged 85 years or over was 17.6% over the study period increasing from 15.2% in 2005 to 18.8% in 2014, Cuzick trend, Z=2.9, p<0.003. The proportion of patients who were female was 49.1% increasing significantly from 48.3% in 2005 to 49.0% in 2016, p<0.01.
Charlson Index
The proportion of patients with a Charlson index of 0 (i.e. with no co-morbidities) decreased from 66.5% in 2005 to 63.1% in 2014, p<0.05) and there was a concomitant rise in the number of patients with a Charlson index score of 10 or more (18.2% in 2005 vs. 21.8% in 2014, p<0.05). The highest proportion with a high Charlson score recorded was in 2010 (23.4%). Those with a high Charlson index score were 1.6 times more likely to be in the older (85+yrs) age group (OR 1.6, 95% CI 1.5- 1.7) ; 1.4 times more likely to have an ICU stay (OR 1.4, 95% CI 1.3-1.5) and were 3.3 times more likely to die in hospital (OR 3.3, 95% CI 3.2-3.4) and twice as likely to have a respiratory diagnosis (OR 2.1, 95% CI 2.12- 2.18) than those with a lower Charlson index score.
As shown in Figure 1, the highest rates per 1,000 population were in the older age groups (aged 80 years and over). The rates also increased in the older age groups only (aged 80 years and over).

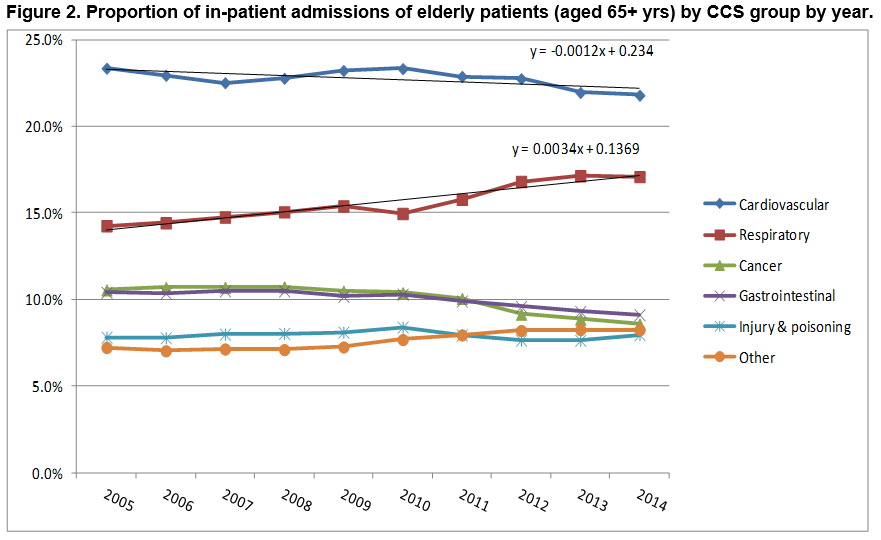
Trends in CCS groups by year
As shown in Figure 2, the most common CCS group continued to be cardiovascular throughout the 10 year study period. However, there was a statistically significant upward linear trend in the respiratory CCS group increasing significantly from 14.2% in 2005 to 17.1% in 2014, Cuzick trend Z = 2.85 p = 0.004.
Length of stay
The mean length of stay (LOS) in 2005 was 11.5 days reducing to 9.7 days in 2014, representing a significant downward linear trend over the study period, Cuzick trend analysis, Z = -2.9, p=0.003.
ICU Length of stay
Almost one in 10 (9%) of patients had a stay in intensive care. There was no linear trend present in the proportion of patients with a stay ICU LOS, Cuzick trend analysis, Z = -0.33, p=0.74. The average ICU LOS for patients who had an ICU stay was five days.
Discharge status
The majority of the patients were discharged home increasing from 74.7% in 2005 to 75.6% in 2014, representing a non-significant upward linear trend, Cuzick trend, Z = 1.83, p=0.066. A total of 90,588 (5.4%) patients died in hospital decreasing from 5.9% in 2005 to 4.7% in 2014, representing a significant downward linear trend, Cuzick trend, Z-2.96, p=0.03.
Discussion
This study has shown that the number and rate of in-patient hospital admissions for the elderly increased over time with a significant increase in the proportion of patients in the older (aged 85+years) age group. There was also a significant increase in the proportion of patients with a Charlson index score of 10 or more which is indicative of complexity. The study also found that patients with a high Charlson index score were significantly more likely to have a respiratory diagnosis, be older and to require an ICU stay than those with a lower Charlson index score. However, despite this apparent increase in complexity, length of stay decreased significantly over time as did the overall proportion of patients having an ICU length of stay and the proportion of patients dying in hospital. This would suggest that although the elderly patients admitted to hospital are older and more complex, the acute hospital has become more efficient at managing these patients as evidenced by the reduced length of stay, the increase in the proportion of patients going home and the reduction in patients dying in hospital.
It is likely that the advent of the clinical programmes in recent years, particularly with regard to the management of acute coronary syndrome and stroke, together with the reorganisation of acute services, and indeed changes in primary care, have contributed to this finding. The picture of increasing complexity in hospitals is likely to continue in light of increased demographic pressures, and those with less severe morbidity being managed in primary care. This is a welcome finding. However, we must not be complacent given that we have an increasingly ageing population which is likely to lead to an increase in the proportion of complex patients. Furthermore, it has been suggested that the demand placed on health services by increasing numbers of older persons with multi-morbidities and thus increasing levels of complexity is being compounded by an accompanying increase in sedentary lifestyles and poor diet12 .
A recent study13 on chronic disease burden among the elderly in Ireland found that two out of five hospitalisations in 2011 occurred due to chronic diseases with 12.5% of the total health sector budget spent on acute hospital care for these patients who are “made complex” by having these chronic diseases. Reducing the modifiable risk factors associated with chronic diseases must be made a priority in Ireland if we want to minimise the impact of chronic diseases on the complexity of patients in the health system. Economic and cost-effective evaluation of public health and health promotion interventions that reduce the burden of chronic disease in the elderly population are urgently needed to inform resource allocation policy to remediate the burden of the complex patient13.
Conflict of Interest
There is no conflict of interest with regard to this paper for any of the authors.
Corresponding Author:
Dr. Anne O’Farrell, Health Intelligence Unit, HSE, Palmerstown, Dublin 20.
Email: [email protected]
References
1. Central Statistics Office (CSO) 2015. Life expectancy in Ireland. http://www.cso.ie/en/releasesandpublications/er/ilt/irishlifetablesno162010-2012/.
2. Safford MM, Allison JJ and Kiefe CI. (2007). Patient complexity: More than Comorbidity. The Vector Model of Compelxity. J. Gen. Intern. Med., 22 (Suppl.3). :382-390.
3. Central Statistics Office (2015). Population and Labour Force Projections 2016-2046. http://www.cso.ie/en/media/csoie/releasespublications/documents/population/2013/poplabfor2016_2046.pdf
4. Tinetti ME, Bogardus ST and Agostini JV (2004). Potential pitfalls of disease –specific guidelines for patients with multiple conditions. N. Engl. J. Med., 351: 2870-2874.
5. Health Pricing Office. 2016. HIPE database. Activity in Acute Public Hospitals in Ireland. http://www.hpo.ie/latest_hipe_nprs_reports/
6. International Statistical Classification of Diseases and Related Health Problems, Tenth Revision, Australian Modification (ICD-AM). https://www.accd.net.au/Icd10.aspx. Accessed June 2016
7. Charlson ME, Pompei P, Ales KL, MacKenzie CR. A new method of classifying prognostic comorbidity in longitudinal studies: development and validation. J Chronic Dis 1987;40(5):373-383.
8. Dr. Foster Intelligence (2014). Understanding HSMRs. A toolkit on Hospital Standardised Mortality Ratios. London, UK.
9. JMP statistical package (program) (2010). 9.0 version. Cary NC, USA.
10. Statiscal Package for Social Scientists SPSS. (2016) IBM SPSS Statistics for Windows, Version 23.0 Armonk, NY: IBM Corp.
11. StatsDirect statistical programme. (2003) 2.8.0 version, Cheshire UK.
12. McPhail S. (2016). Multimorbidity in chronic disease: impact on health care resources and costs. Risk Management and Healthcare Policy, 9: 143-156.
13. Jennings S. (2014). Preventing Chronic Disease: Defining the problem. Report from the Prevention of Chronic Disease Programme. Health Service Executive. ISBN:978-1-908972-05-7.
P672