Recession, Austerity and Life Expectancy
D. Dorling1, J Rigby2
1. School of Geography and the Environment, University of Oxford, South Parks Road, Oxford, OX1 3QY, UK
2. Centre for Health Geoinformatics & Department of Geography, Maynooth University, Ireland
Introduction
For many decades, in affluent countries life expectancies have been improving approximately 2 years every decade1. Life expectancies for females remain higher than for males, although explanations remain unresolved2,3. In the UK improvements in life expectancy at birth have slowed since 20104. Most recently, life expectancy in some areas of England has fallen by more than one year since 20115. This is an extraordinary reversal.
There was a corresponding slowing in life expectancy remaining from age 65, from increasing 1 year every 6 years for women to 1 every 16 years, and for men from 1 year every 5 years down to 1 year for every 9 years4. In Ireland, life expectancy at 65 has continued to increase, but has slowed substantially from a gain of 3 years between 1995 and 2005 to 1.9 years between 2005 and 2015 (for men) and from 2.6 years down to 1.2 years for women6. Full European figures for life expectancy for 2016 are yet to be released. However, in the USA, life expectancy has now been falling for at least two years7.
This short paper examines recent trajectories of life expectancies across Europe following the recent global recession, and through the implementation of greatly varying national ‘austerity’ policies, particularly where those cut public sector expenditure. Recession and austerity could be predicted to impact most heavily on the most vulnerable, particularly if health and/or social care budgets were affected (as in the UK).
Socioeconomic inequalities in mortality in Europe8 suggested between-country variation was partly attributable to smoking, alcohol consumption, obesity and poverty. Ireland was not included in this study, but has relatively high rates of these risk factors9.
Methods
Life expectancy data from 1993 to 2015 were extracted from Eurostat’s on-line datasets to produce comparative trajectories of recent outcomes for 10 European countries (Figure 1 below). For Ireland, mortality from 2011 to 2016 for those aged 65-84 was examined against the previous trend. That trend was the average annual decline in age/sex mortality rates between 1986 (when the statistics were first thought to be very reliable) and 2008 (the start of the global financial crash). For 2016 mortality numbers remain provisional as at January 2018.
Results
Figure 1 (below) provides a comparison of the trajectories of recent life expectancy data across Europe.
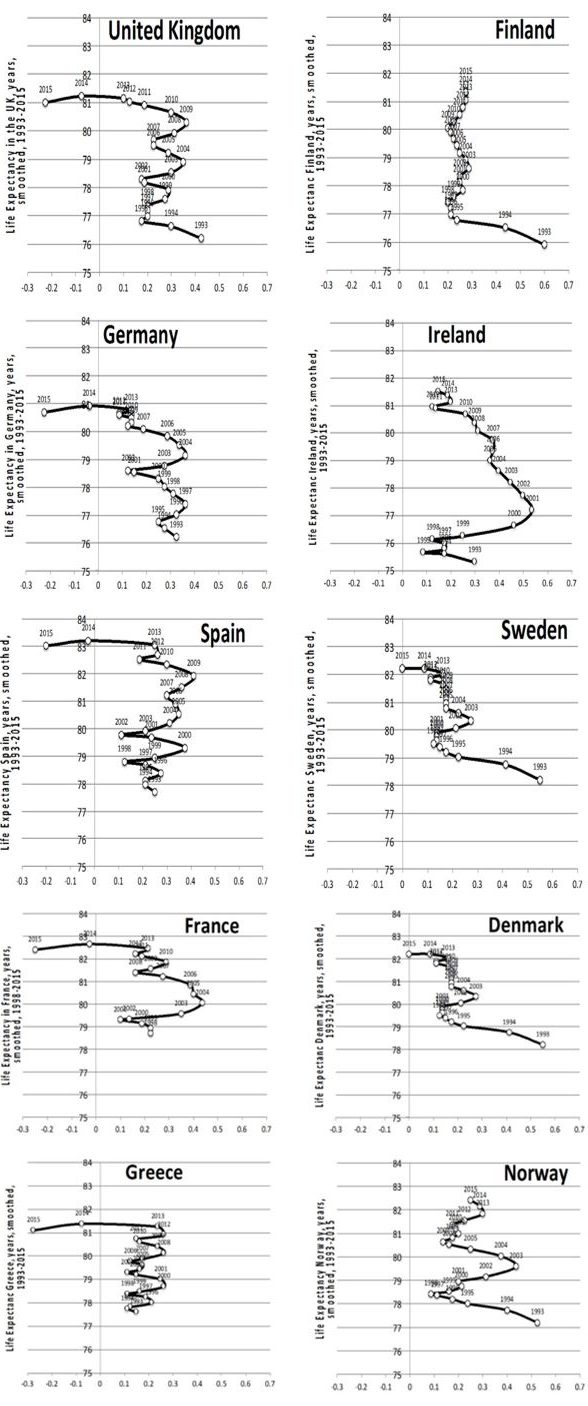
Figure 1: Life Expectancy in Ten Western European countries 1993-2015. The Irish trajectory has stalled, though is less severe than for Greece, the UK, and Western mainland countries. Data source: Eurostat (on-line publically accessible data). Rate of change is shown by position on the X axis.
Between 1 January 2011 and 31st December 2016 82,707 men and women died in Ireland who were aged 65-84. The total number who have died earlier than expected is 1723.
Table 1 shows the number of deaths each year by ten-year age group and sex and how greatly this varies from what would have been expected if the better rates from previous years had prevailed.
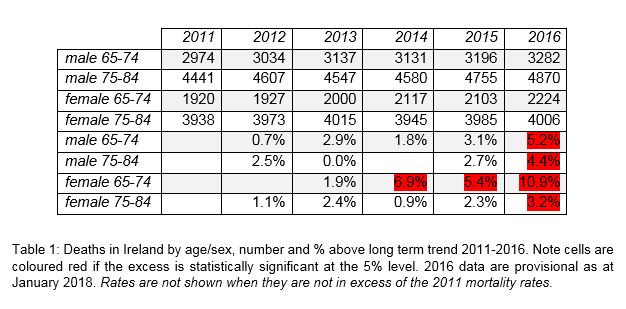
Table 1: Deaths in Ireland by age/sex, number and % above long term trend 2011-2016. Note cells are coloured red if the excess is statistically significant at the 5% level. 2016 data are provisional as at January 2018. Rates are not shown when they are not in excess of the 2011 mortality rates.
The first notable rise in mortality was among women aged 65-74 in 2014 when rates were 6.9% above the long term trend (CI 2.4%-11.6%). That excess had risen to 10.9% by 2016 (CI 6.3%-15.6%), and by then the rates for older women and for men aged 65 to 84 were also significantly above the long-term trend.
On August 7th 2018 the UK Office for National Statistics (ONS) released statistics calculated from the World Mortality Database10 that revealed that life expectancy in the UK was lower for both men and women in 2015 and 2016 than the high point attained in 2014. This was in contrast to all the other 19 countries that the ONS considered, and for which 2016 data existed, where life expectancy was at its highest in 2016 for both men and women. Whatever had occurred in the UK was different from elsewhere. Ireland was not included in the ONS comparison and 2016 data for the USA is still not available.
Discussion
The decade upon decade increase in life expectancy in rich countries has been assumed to continue, informing growing awareness of the ‘ageing population’ and population projections. The stalling, and indeed reversals, now being identified may challenge this assumption. It will not be known for some time whether this is a temporary phenomenon in response to the global recession, but Finland and Norway did not chosen austerity and have not seen any reduction in life expectancy gains which might be telling (see Figure 1 above). In contrast, life expectancy in the UK in 2016 and 2017 was still below that recorded in 2014.
Life expectancy in Ireland was rising through 2011, though the average age of hospital patients remained at 77.0 for each year 2012-1411. The recent change in older age mortality is a major shift. It is clear in 2016, but had begun at least by 2014, with some evidence of rises in 2012. The evidence is most pronounced in the female 65-74 age group indicating a rise in premature mortality for this group. Both Ireland and the UK have resisted calls to cut old-age pensions, though the UK inflicted severe cuts in the social care budget, and in means tested benefits for poorer pensioners. The UK has seen proportionately larger rises in older age mortality continuing through to 201812. The divergence currently underway across Europe since 2014 begs the question: into which group of countries will Ireland fall and why? The situation requires very careful monitoring.
Conflict of Interest
The authors declare that there is no conflict of interest.
Corresponding Author
Prof. Jan Rigby,
Centre for Health Geoinformatics,
Iontas Building,
Maynooth University,
Co Kildare,
Ireland.
Ph: 01 708 6181
Email: [email protected]
References
1. United Nations Development Programme Human Development Data 2016; hdr.undp.org/en/data. Accessed January 2018.
2. Barford A, Dorling D, Davey Smith G, Shaw M. Life expectancy: women now on top everywhere BMJ 2006; 332
3. Rigby JE, Dorling D. Mortality in relation to sex. Journal of Epidemiology and Community Health. 2007; 61:159-164.
4. Marmot M, Donkin A, Goldblatt P. Marmot Indicators Briefing 2017 – updated. UCL Institute of Health Equity, London.
5. Smyth C. Life expectancy falls by a year in several regions of England. 2018. The Times, January 17th.
6.Department of Health. Life expectancy. http://health.gov.ie/publications-research/statistics/statistics-by-topic/life-expectancy/ Accessed January 2018.
7. Berstein l, Ingraham C. Fueled by drug crisis, U.S. life expectancy declines for a second straight year, The Washington Post,2017, December 21st
8. Mackenbach JP, Bopp M, Deboosere P, Kovacs K, Leinsalu M, Martikainen P, Menvielle G, Regidor E, de Gelder R. Determinants of the magnitude of socioeconomic inequalities in mortality: a study of 17 European countries. Health & Place, 2017; 47:44-53.
9. OECD/European Observatory of Health Systems and Policies. Ireland Country Health Profile 2017, State of Health in the EU. OECD Publishing, Paris/European Observatory of Health Systems and Policies, Brussels. http://dx.doi.org/10.1787/9789264283435-en. Accessed January 2018.
10. ONS Changing trends in mortality: an international comparison: 2000 to 2016,
Accessed September 2018, https://www.ons.gov.uk/peoplepopulationandcommunity/birthsdeathsandmarriages/
lifeexpectancies/articles/changingtrendsinmortalityaninternationalcomparison/2000to2016
11. Johnson H, O’Farrell A, McKeown D, Sayers G, Hayes C, Beaton D. Is Increasing Life Expectancy Leading To More Complexity? Irish Medical Journal 2018;111.
12. Hiam L, Dorling D, McKee M. The age-sex standardised mortality rate for deaths in England has risen by 5% in 12 months, Rapid response, British Medical Journal, June 20th 2018, https://www.bmj.com/content/360/bmj.k1090/rr-12
P876